Yet another post in our "fun facts" section:
We’re building a lighting and music control logic for a public restroom using the event-driven KNX bus system. Here’s a detailed description of the logic:
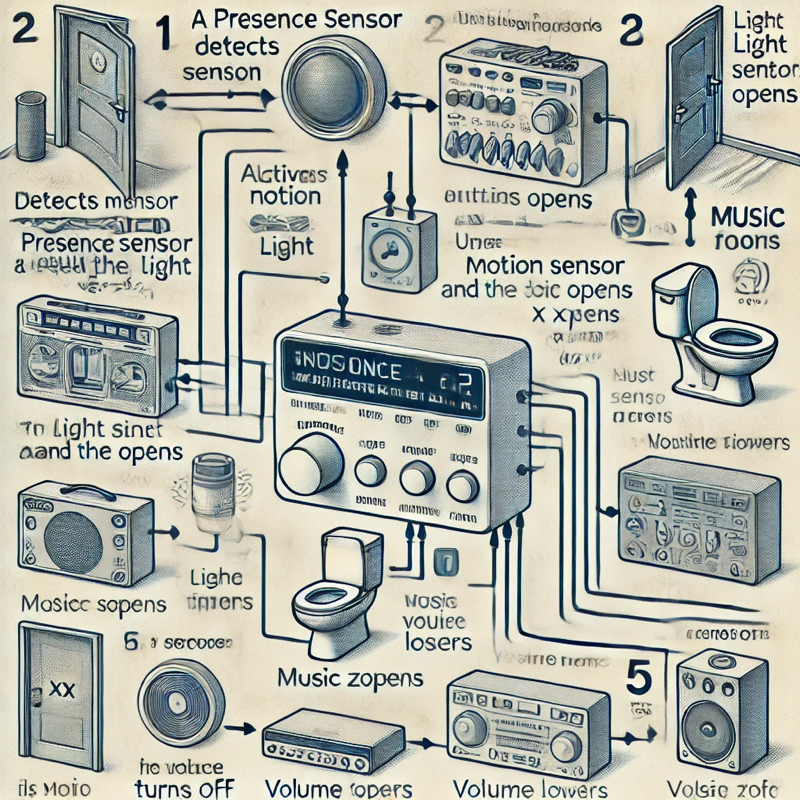
The restroom features a presence sensor and a door sensor (reed contact). When the presence sensor detects movement, the light switches on. Using the status feedback from the light actuator, we trigger the music playback.
The reed contact is processed by a logic module:
- IF the light is off AND the door is opened, DO NOTHING
- IF the light is on AND the door is opened, start a STAIRCASE TIMER for 5 seconds. WHEN the timer ends, BLOCK the motion sensor, then UNBLOCK it after 1 second. This switches off the light and resets the sensor for the next person entering
The music is controlled via status telegrams and logic:
- When the light status is ‘1,’ START the 1st audio source (radio) and set the volume to xx%
- The radio intro text takes 8 seconds to play, so after 8.5 seconds, we increase the volume
- When the light status is ‘0,’ we turn off the music in the zone
We asked ChatGPT to visualize the logic in a flowchart—here’s the result:

